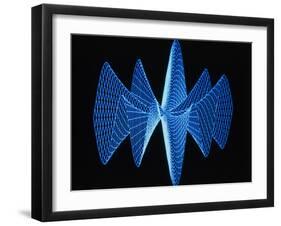
Computergenerated threedimensional graphical plot of a complex mathematical function. With functions that vary in three dimensions, a 3D plot is by far the easiest form of visualisation. The example here is of a projection of a modified sinusoidal wave from an origin, rotated about the vertical axis. The function used here is: Z(POW(X,2)+POW(Y,2))*(SIN(8. *ATAN2(X,Y))).